By Gaurav Mathur – Head, User Experience (UX) Design, Myntra
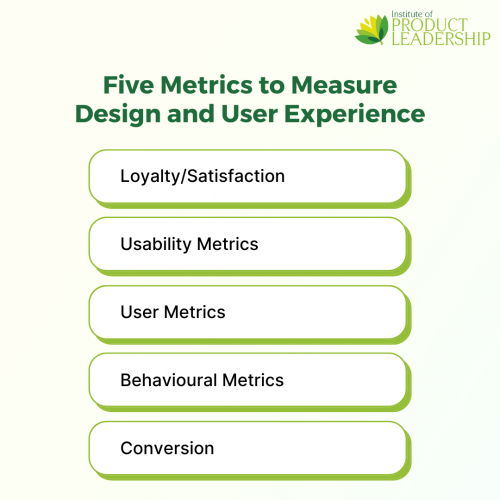
Have you ever wondered what makes a product truly great? The answer lies not in intuition, but in cold, hard data. This blog delves into the world of product design metrics, the secret language that unlocks insights into user behavior, loyalty, and ultimately, a product’s success. We’ll explore five key categories – loyalty & satisfaction, usability, user engagement, behavior, and conversions – providing you with the tools to measure, analyze, and improve your product like a pro
One of the key categories of product metrics is loyalty and satisfaction. This category includes metrics such as net promoter score (NPS), customer satisfaction score, and customer effort score. NPS measures how likely users are to recommend a product to others, while customer satisfaction score and customer effort score assess the ease of dealing with a company. These metrics provide insights into the loyalty and satisfaction levels of customers, which are important indicators of a product’s success.
Usability metrics focus on how usable and easy to understand a product is. Examples of usability metrics include task success, task completion time, and system usability scale (SUS). Task success measures the percentage of users who can complete a task successfully, while task completion time quantifies the time it takes for users to finish a task. SUS is a survey-based metric that assesses the usability and learnability of a product. Usability metrics help identify areas of improvement and ensure that a product is user-friendly.
User metrics provide insights into the number of users using a product and their behavior. The churn rate measures the percentage of users who stop using a product over a given period, while the retention rate indicates the percentage of users who continue to use a product regularly. These metrics help assess user engagement and identify strategies to increase user acquisition and retention. For example, a mobile app with a high retention rate will likely have a loyal user base.
Behavioral metrics focus on how frequently users interact with a product and the level of engagement they have. Metrics such as active users, sessions, and content consumption provide insights into user engagement and usage patterns. For social media platforms, engagement metrics like daily active users and monthly active users are particularly important. These metrics help assess the level of user engagement and the popularity of different features within a product.
Conversion metrics measure the effectiveness of a product in converting users to take a specific action, such as clicking on a button or completing a sign-up process. Click-through rate (CTR) is a commonly used metric to measure how often a button or link is clicked. Funnel analysis is another important conversion metric that tracks drop-off rates at different user journey stages. These metrics help identify areas where users may be encountering obstacles and provide insights for improving the conversion rate.
In conclusion, product metrics play a crucial role in assessing the performance and user experience of a product. By measuring various aspects such as loyalty, usability, user behavior, and conversion rates, product teams can make data-driven decisions to improve their product and enhance user satisfaction.
About the Author:
Gaurav Mathur – Head, User Experience (UX) Design, Myntra
Institute of Product Leadership is Asia’s First Business School providing accredited degree programs and certification courses exclusively in Product Management, Strategy, and Leadership.
Talk to a counselor today and embark on your journey towards becoming an exceptional product manager.
Whether you’re seeking advice on career paths, looking to enhance your skills, or facing challenges in your current role, our counselors are ready to provide valuable insights and actionable strategies.